Websites guide
Updating the College's websites
Through the College's (WAM), you are able to edit your:
- Profile pages (Academics, Experiment Station, Extension)
- Publication / scholastic works pages (Academics, Experiment Station, Extension)
- Program pages and subsites (Experiment Station, Extension)
- Directory listings (Experiment Station, Extension)
For help updating web content hosted outside of this system (e.g. academics webpages), request marketing support.
Website marketing strategy
See the College's digital marketing guide.
Logging in
You log in with your full email address and your password, not your NetID. If you ever forget your password, click the reset password link to set a new one.
Required training
The University requires anyone creating online content, such as for websites, social media, WebCampus courses, emails, etc., to complete Basic Web Accessibility Training annually. Between trainings, reference the web accessibility cheat sheet.
Instructions
Once logged in, reference the information below to make changes. If you need help, request marketing support.
Web accessibility
Updating webpages
-
- Profile pages
- Program pages
- Adding program pages
- Editing program pages
- Adding events to program pages
- Adding publications to program pages
- Video: Making the post of your program page
- Publication pages
- Video: How to add a publication to WAM
- Events pages
Newsletters
- Getting featured in University and College newsletters
- Starting a new newsletter
- Selecting the best format
- Selecting the best software
- Tips for creating newsletters
Photo sliders, video galleries and overlay tiles
What web content gets posted where and how?
Below are answers to frequently asked questions about what web content gets posted where and how. For additional information or assistance on these topics, please send in a marketing support request.
A: Permanent, non-student employees get a people page on their tenure home website (primary / canonical) and their other appointments’ websites, if applicable (secondary / redirect)
As notified by the College’s human resources team, the College’s communications team creates people pages for all new employees of the College, except temporary, volunteer or affiliate workers; undergraduate, graduate, doctoral or postdoctoral workers; or Extended Studies employees. (The Extended Studies website does not have directory or people pages. So, profile pages are not created for Extended Studies employees unless they also have a role in another part of the College.)
Although the communications team creates profile pages, employees and departments are responsible for maintaining them. For alignment with University webpage standards, people pages should be accurate and complete and reviewed for updates at least three times per year. To request a new profile page or access to update existing ones, submit a marketing support request.
When the communications team creates profile pages, they do so based on the employee’s tenure home and role(s).
Profile pages for College leadership, dean’s team, Student Center or academic program employees are created in the University’s Content Management System (CMS), under the relevant unr.edu/cabnr webpage (e.g., Contact, Student Center, Tribal Students Program, etc.).
Profile pages for academic department employees are created in the University’s CMS, under the relevant academic website (unr.edu/AVRS, BMB, NRES or Nutrition).
Profile pages for Experiment Station and Extension employees are created through the directory database, which is part of the College’s Websites Assets Management System.
It is common for an employee to have more than one role in the College. For example, almost every academics professor is also an Experiment Station researcher. For these employees, the communications team creates a primary / canonical profile page for them on the website for their tenure home (e.g., their academic department), as well as secondary / redirected profile page(s) on the website(s) representing their other appointments (e.g., Experiment Station or Extension).
This recognizes the employee’s tenure home while ensuring they’re also represented on all other websites appropriate to their role.
It also provides each employee with the WAM access important to their role (e.g., access to Experiment Station research grants and facility reservation systems, and to Experiment Station and Extension publications and programs databases).
When an employee has profile pages in both the CMS and WAM, the communications team connects them, so that most employee updates in WAM are automatically reflected on the CMS (e.g., updates to summary, education, courses, honors and awards, accomplishments, service, publications, etc.).
However, it’s not yet possible to automatically apply WAM photo updates to the CMS, so employees wishing to update their headshot on their CMS should submit a marketing support request.
A: Things that are time-bound
All happenings hosted by our College, including those that are a part of a program, should be posted to . This events platform, powered by a software called Localist, populates all events calendars, pages and widgets across all University, College, unit, department, office and program webpages.
Simple events should be posted using the . Complex events should be posted using the .
The use of either form will result in the creation of a webpage for the event. Additionally, the proper completion of the event tags section of the form will result in the event’s inclusion on all relevant University, College, unit, department, office and program webpages.
This provides event organizers with at least two webpages to use in their event promotion efforts: the event’s calendar page and its program page.
In most cases, additional webpages for events are not needed and will not be created. However, should a program wish to request an additional webpage for an event, their first steps are to:
- Post the event to , tagging the program in the posting.
- Ensure the program’s webpage includes a calendar widget, and the widget is pulling the event’s info onto the program’s webpage. (If not, send in a marketing support form.)
- Update all other sections of their program’s webpage.
- Send in a marketing support request.
A: Things that are big, multi-faceted and long lasting
A program is a multi-faceted, long-term plan of activities and resources geared to accomplish a specific goal.
Through programs, our College deeply engages in Nevada communities, continually sharing unique expertise in a variety of ways to impact significant, lasting change.
Such engagement often encompasses the expert delivery of:
- Publications and resources - Articles, publications, curricula, posters, presentations, newsletters, informative multimedia content, etc.
- Educational events and experiences - Courses, conferences, forums, workshops, classes, labs, seminars, trainings, demonstrations, apprenticeships, mentorships, etc.
- Research activities - Studies, trials, projects, analyses, etc.
In most cases, a program page is the best tool for representing such overarching endeavors.
Program pages are created, maintained and reviewed on a set cycle through the programs database, which is part of the College’s Websites Assets Management System.
To request a new program page or access to edit an existing program page, submit a marketing support request.
In rare cases, a program may instead be represented on the web by a subsite. See the web subsites FAQ for details.
A: Extraordinarily large, productive and well-staffed programs or initiatives
Well-developed program pages for extraordinarily large programs publishing significant quantities of high-quality web content and with sufficient, permanent, program-level bandwidth to maintain that content may be converted to a subsite at marketing’s discretion.
Strategic, College-level initiatives identified by College leadership, spanning multiple programs and/or program areas, producing significant quantities of high-quality web content, and allocated sufficient, permanent resources external to the College’s communications team for the proper maintenance of that content may also be appropriate to be represented on the web as a subsite at marketing’s discretion.
Programs and initiatives working towards but not yet meeting the criteria for a subsite will be represented on the web as a program page until the subsite criteria are met.
Program subsites are created and maintained through the web subsites database, which is part of the College’s Websites Assets Management System. To request a new subsite, access to edit an existing subsite or for assistance developing a plan to meet the criteria for a subsite, submit a marketing support request.
Please note that the criteria for the creation of a subsite does not include a preference for the subsite template over the program page template, or a desire for additional support from the College’s communications team. It is also not a measure of the importance, value or impact of a program or initiative.
A: News stories, impact reports and educational articles for internal and external audiences
Publications pages are the best tool for publishing news stories, impact reports and educational articles to the College’s websites for use by internal (e.g., employees or volunteers) and external (e.g., grantors, elected officials, other researchers or the public) audiences.
There are many categories of publications pages. While full details on that are below, it is important to note that there is not a category for promotional publications.
If a document’s purpose is promotional, rather than educational, it is not suitable for publishing to the College’s websites via its publications database. However, it is likely suitable for publishing via another mechanism. For example, promotional content for events is appropriate for posting to the event’s webpage (see the event pages FAQ), and promotional content for programs is appropriate for posting to the program’s webpage (see the program pages FAQ).
No matter the category of publications page, creation and maintenance is through the publications database, which is part of the College’s Websites Assets Management System.
Authors can create and edit publication pages by logging into the system. For access to create or edit publications pages for other people, submit a marketing support request.
A: News stories
Table 1: Publication page categories for news stories
| Category | Description | Example |
|---|---|---|
| Media release or advisory | News stories for publishing by media outlets and/or on University, College, unit, department, office and program news pages. |
Nevada Today news story example: Program news story example: |
A: Impact reports
Table 2: Publication page categories for impact reports
| Category | Description | Example |
|---|---|---|
| (Extension) county report |
For Extension use only Brief summary of the work and finances of an Extension office in a fiscal year. Follows strict requirements for content, length and dates. Contact your area director’s office for details. |
|
| DFI annual report |
For Desert Farming Initiative use only Summary of DFI’s work and finances over a one-year period. |
|
| Reports and updates |
For impact statements and all other annual reports For details on writing impact statements, see the impact stories FAQ. |
Annual report example: Impact story example: |
| Research reports |
Formal document detailing the background, activities, findings and impact of a research project, EXCEPT those published in another category (e.g., journal article, Extension fact sheet, Extension special publication; see Table 4). |
A: Educational articles for employees and volunteers
Table 3: Publications page categories for internal educational articles
| Category | Description | Example |
|---|---|---|
| Forms and templates | ||
| Policies and procedures | ||
| Protocols |
A detailed plan or standardized procedure that outlines how a research study, experiment, or analysis will be conducted. |
|
|
Tips, tricks and how-tos |
A: Educational articles for the public - Our original, expert-generated, widely useful, relatively evergreen, science-based knowledge
Publications pages in these categories are for original, science-based educational or research materials authored by College subject-matter specialists to convey expert-generated, research-based knowledge that’s widely useful and relatively evergreen.
These materials may be produced in a variety of formats (see list below) and should be reviewed on a set cycle (e.g., every 1-5 years), as appropriate for their contents.
They may or may not be peer-reviewed.
When writing peer-reviewed Extension-publications (categories marked with an *), authors should follow . When writing peer-reviewed journal articles, authors should follow the publishing journal’s specifications.
Table 4: Publications page categories for external educational articles
| Category | Description | Example |
|---|---|---|
| Abstract | Short summary of a longer academic work (e.g., peer-reviewed journal article, conference paper, thesis or dissertation). | |
| Blog post |
An expert’s viewpoint on a topic that is important to the College and the communities we serve. Written in the first person, using warm, friendly, conversational language at about a sixth-grade reading level. |
’s blog and its post: “” |
| Book chapter | Section of a book. | |
| Book review | Summary of a book with an expert opinion on its content, style and merit. | |
| Book |
Long-form work on a specialized topic, available in print or digitally, and assigned an ISBN number. Often written for scholarly audiences, but may be written for lay audiences as well. |
|
| Brochure | Brief informational guide. Written in the third person, using warm, friendly, conversational language at about a sixth-grade reading level. | |
| Bulletin | ||
| Curriculum materials* |
Learner-centered, pilot-tested publications developed primarily as teaching resources and lesson plans. Often written for use by academic or industry professionals (e.g., higher-ed professors, K-12 educators, certified childcare providers), but may be written for lay audiences as well (e.g., parents, 4-H volunteers, etc.) |
|
| Dataset | An organized collection of related data useful for reference and analysis. | |
| Fact sheet* |
Concise, stand-alone, narrowly focused document designed to educate stakeholders about identified community needs. Written in the third person, using warm, friendly, conversational language at about a sixth-grade reading level. |
|
| Field guide |
Guide to identifying aspects of nature (e.g., rocks, minerals, plants, animals, insects). Written in the third person. While guides for expert use may use more technical language, guides for public use should use warm, friendly, conversational language at about a sixth-grade reading level. |
and its entry: “” |
| Frequently asked questions |
A list of questions and answers designed to educate stakeholders about identified community needs. Written in the first or third person. While FAQs for expert use may use more technical language, FAQs for public use should use warm, friendly, conversational language at about a sixth-grade reading level. |
and its entry: “” |
| Informational publication |
Similar to a fact sheet or special publication, but not peer-reviewed. Designed to educate stakeholders about identified community needs. Written in the third person, using warm, friendly, conversational language at about a sixth-grade reading level. |
|
| Journal article |
Scholarly articles written by researchers and published in scientific journals for other scientists to read. Often, but not always, peer-reviewed. Written in the third person using technical language. |
|
| Lay or popular publication |
Informational articles published in lay (vs. scientific) publications (e.g., newspaper or magazine articles). Written in first or third person, as appropriate for the publishing outlet, using warm, friendly, conversational language at about a sixth-grade reading level. |
|
| Map |
A symbolic representation of a place, usually focusing on particular aspect(s) of it (e.g., population density, radon potential). Must follow best practices for map design AND meet University standards for branding (e.g., brand fonts and colors) and accessibility (e.g., high color contrast, low-to-no text on the image, etc.) For best results, consult the web team at the idea stage, before work begins; work with an accessibility-trained designer; and design maps to be accessible from the start. Remediating maps for accessibility later is challenging, time-consuming and expensive. |
|
| Music or lyrics | Musical arrangements (vocal and/or instrumental) or song lyrics. Designed to deliver educational messages about identified community needs. | |
| Newsletters |
Designed to educate stakeholders about identified community needs. Written in first or third person, as appropriate for the publishing outlet, using warm, friendly, conversational language at about a sixth-grade reading level. |
, including the |
| Online courses | On-demand programs of study offered asynchronously online. | s Virtual Classroom ( and ), including this |
| Podcasts |
Series of audio/visual files recorded and posted online for on-demand watching, streaming and/or downloading. Must follow best practices for podcasting / videography AND meet University standards for branding (e.g., brand fonts and colors) and accessibility (e.g., high color contrast, low-to-no text on the image, accurate captions, video descriptions, etc.) For best results, consult the web team at the idea stage, before work begins; work with an accessibility-trained podcaster / videographer; and design the podcast audio and/or videos to be accessible from the start. Remediating podcasts for accessibility later is challenging, time-consuming and expensive. |
|
| Presentations |
Information delivered by a speaker to an audience (e.g., as part of a class, workshop, symposium, etc.). Presentation slides and videos must follow best practices AND meet University standards for branding (e.g., brand fonts and colors) and accessibility (e.g., high color contrast, low-to-no text on the image, accurate captions, video descriptions, etc.) For best results, consult the web team at the idea stage, before work begins; work with an accessibility-trained designer / videographer; and design the presentation slides and/or video to be accessible from the start. |
|
| Professional paper | Formal, written document that summarizes, critically reviews and explains the practical impacts of a body of research. | |
| QR codes / hidden pubs | The template used for this type of scholastic work is optimized for mobile devices and will not appear on the main library or profile pages. The intent is to provide additional information to a subject where the QR Code has been placed. | |
| Recipes | Instructions, ingredients and nutritional information useful for planning, shopping for, preparing, enjoying, and safely storing and reheating meals. | , including this recipe |
| Reviews | A scholarly work that synthesizes, analyzes, and evaluates existing research on a specific topic rather than presenting new experimental data. | |
| Software | A digital tool, application, or package that implements algorithms, workflows, models, or data-processing methods for research or educational purposes. | |
| Special publications* | Educational materials that represent a major writing effort and contain multiple topics or in-depth coverage of a single, complex topic. | |
| Surveys | ||
| Technical publications | To be used when a document applies research or technology development — especially if it’s institutional, grant-funded or government-produced, detailing methods, data, processes or system designs. | |
| Thesis / dissertation | Research papers written by master’s or doctoral students, demonstrating mastery of current research and ability to conduct original research, as appropriate to their degree’s completion requirements. | |
| Trade journals | Article published in an outlet that focuses on a specific industry, trade or profession (e.g., Landscape Nevada, the official publication of the Nevada Landscape Association) | |
| Videos |
May be long- or short-form, in landscape or portrait orientation, using technical or lay language, as appropriate for the video’s target audience and goals. Must follow best practices for videography AND meet University standards for branding (e.g., brand fonts and colors) and accessibility (e.g., high color contrast, low-to-no text on the image, accurate captions, video descriptions, etc.) For best results, consult the web team at the idea stage, before work begins; work with an accessibility-trained videographer; and design videos to be accessible from the start. Remediating videos for accessibility later is challenging, time-consuming and expensive. |
|
| White paper | A persuasive or informative document intended to influence decision-making or summarize evidence on a policy, program, or emerging issue. |
A: A storytelling snapshot showcasing the value of a program or set of related programs at a specific moment in time
Impact stories showcase critical issues facing Nevada’s people, businesses and communities; how we’re uniquely poised to address those issues; the work we’re doing in order to address them; and how that work has and will continue to be a catalyst for a better Nevada.
They’re written as inspirational narratives, weaving together data, lived experiences and multi-media elements to intellectually and emotionally connect people with our College and immerse them in the transformative power of our work.
They have a beginning, middle and end, conveying a specific moment in time in a voice that’s warm, informative and kind, like good friends telling stories over a cup of coffee or tea.
Impact stories are published on the web as a publications page in the “Reports & Updates” category, through the publications database, which is part of the College’s Websites Assets Management System.
Authors can create and edit publication pages, including impact stories, by logging into the system. For access to create or edit publications pages for other people, submit a marketing support request.
Note: The process for posting impact stories to the web is different from the process for posting program pages to the web. This is because program pages and impact stories serve different purposes, use different web elements and are maintained differently.
The purpose of a program page is to provide the latest information about a program to galvanize immediate action (e.g., subscribe, apply, register, donate, learn, contact). This focus requires specific elements included on the program page template (e.g., events calendar and team contacts widgets) and requires continual updating by multiple staff at various levels, which is supported by features and permission levels built into the programs database.
In contrast, impact stories are a snapshot of a specific moment in time. In that moment, their purpose is to increase general awareness of and support for a program. After that moment, their purpose is to serve as a historical record of the program’s activities. This focus requires specific elements included on the publications page template (e.g., authors and year) and functionality supported by the publications database (e.g., organizing content by date and affiliating it with various other author and program pages).
Even though program pages and impact stories are two separate pieces of content, they can be used together. Doing so is an effective way to connect people with both the historical and present-day impact of a program.
Examples of this are:
- Featuring info from and a link to a recent impact story on a program’s webpage.
- Creating a reports section on a program’s webpage, with impact stories listed in it.
- Linking to a program page from an impact story.
A: Because it’s more efficient and effective to publish information online as webpages instead of as documents, and, if a document is required, PDF remains the gold standard.
Word docs aren’t housed within the unr.edu ecosystem, per University policy.
In general, it’s better to publish information online as webpages instead of as documents anyway. Webpages are more findable and usable for our end-users. In many cases, they’re also faster and easier to post, as all documents, regardless of file type, must meet University accessibility standards.
In cases where it’s not possible to post the document’s contents as a webpage, PDF remains the gold standard for publishing documents online. All PDFs shared out for work purposes must be shared out from within the unr.edu ecosystem.
Training on remediating documents for accessibility is available from the University.
Details on why PDFs are the gold standard is below.
Accessibility and compatibility
- Subscriptions are a barrier: Not everyone has a Microsoft Office subscription. While there are free alternatives, they don't always render Word docs well.
- Mobile experience is better: Most mobile browsers can preview a PDF instantly. Opening a Word doc usually requires downloading the file and opening a separate app, which is a major friction point for users.
- Accessibility is more supported: While Word has accessibility features, PDFs are the industry standard for tagged content that assists visually impaired users who use screen readers.
Security and metadata risks
Word documents are living documents. They often carry a hidden history that you might not want the public to see:
- Track changes: If you didn’t "Accept All Changes" properly, a savvy user can see your previous drafts and deleted comments.
- Metadata: Word files often store the author's name, total editing time and file paths on your local server.
- Malware: Historically, Word macros have been a common vector for viruses. Many security-conscious users are (rightly) hesitant to download Word docs from the internet.
Search engine optimization (SEO)
While Google can index Word documents, it prioritizes PDFs in search results because they are considered final versions of content.
PDFs are also more likely to appear directly in search results.
The "What you see is NOT what they get" problem
Word documents are reflowable, meaning they adapt to the software and settings of the device opening them.
- Font substitution: If you use a fancy font that the visitor doesn't have installed, Word will swap it for something else, such as Comic Sans (the horror!), potentially breaking your layout.
- Version mismatch: A document created in Word 2024 might look completely different or fail to open in a version from 2016.
- PDF advantage: A PDF is essentially a digital printout. It preserves fonts, images and layout regardless of the device.
A: They’re created to be on-brand and accessible using University-approved tools, and they’re shared out from within the unr.edu ecosystem, such as through publications, programs and events webpages.
The expectation is that all online forms are:
- Created using a University-approved tool.
- Compliant with University and College policies, including those related to accessibility and branding.
- Shared out from within the unr.edu ecosystem.
University-approved forms solutions
The University-approved tool to use depends on whether the form you want to create and share online is for use in print or for completion online, and whether it is for an event, student recruitment or something else.
Forms for completion online
If the form can be completed online, University-approved options include Localist, Slate, Formstack, Microsoft Forms and Qualtrics.
If the form is to capture registration for an event, the University tool to use is Localist.
Everyone with a NetID has access to post and manage their own events with this tool. For access to manage events posted by others, request to become a Group Event Editor. It is recommended that all members of a program team request Group Event Editor access, so that everyone on the team can manage the team’s events, even if they were posted by another team member.
For details, see the University’s webpage on Localist.
Note: This tool does not yet support registration for paid events, although the University is working towards being able to offer that feature. In the meantime, third party tools, such as Eventbrite, may be used in addition to Localist, to collect registration for paid events. For details, see the Eventbrite guide, found in the College’s brand toolkit.
If the form is for student recruitment, the University tool to use is Formstack or Slate.
Licenses for both are extremely limited and only granted under specific circumstances. For details, see the 's entry about and the University’s Formstack guidelines.
If the University does not have a Formstack license available for you to use, but you need a Formstack form, send in a marketing support request, as the web team may be able to assist.
If the form is to capture other information (needs assessment, program pre-/post-tests, after-event surveys, etc.), the University tools to use are Microsoft Forms or Qualtrics.
Both will do the trick and are available to anyone with a NetID. Use whichever one you’re most familiar and comfortable with. For details, see the University Office of Information Technology Support Center entries about and .
Also consult with your local IT professionals on ways to ensure your program’s forms are protected for longevity in case of team member turnover.
Forms for use in print shared online
Note: This process can be quite cumbersome. It is not to be used for event registration. It is not recommended for time-bound forms that’ll be in use for a short period (e.g., needs assessments, surveys), as opposed to evergreen forms that’ll be in use long-term (e.g., record books).
Before beginning, be sure to check:
- Must the form be completed in print, or could it be completed online instead?
- If the form must be completed in print, must it be shared online for others to print, or could you print and distribute physical copies instead?
If the form you want to share online is for use in print, the tools to use are Microsoft Word and Adobe Acrobat Pro. Following University accessibility policy, create the form to be accessible in Microsoft Word, export the form to a PDF, and check and remediate it for digital accessibility in Adobe Acrobat Pro. Accessibility checks are easier to complete when you also have a color contrast checker installed. There are many out there. One is .
For access to Microsoft Word and Adobe Acrobat Pro, see the University Office of Information Technology Support Center entries on and . For training on Word and Adobe, contact your local IT professionals. For training on accessibility, see the University Teaching & Learning Technologies webpage on training.
Tips for creating forms
To prevent rework, design forms to be as evergreen as possible. This is especially important for Slate and Formstack forms, as access to update them is limited, as well as for PDF forms, as any updates made later will require you to re-remediate the form.
To do that, keep form content limited to form content. Do not put any accompanying instructional or procedural details form submitters should know (e.g., form routing procedures or response times; contact names, titles, email addresses or phone numbers; program dates, times, locations; or sponsorship tier benefits, etc.) on the form itself. Instead, put that information on the webpage where folks will go to download or complete the form.
Additionally, if the form is to be used for more than one year, don’t put the year on the form. Instead, put that info on the unr.edu webpage where folks will go to download the form (e.g., ).
As you create your form contents, questions, and notification and confirmation emails, reference the:
- College’s brand compliance checklist*
- College’s print and digital accessibility guide*
- University’s accessibility policy* and Basic Web Accessibility Training
*Note: These resources have applications to all forms, even those that won’t be shared or completed online.
For questions or support, reach out to the College’s communications team.
Tips for sharing out forms
Updating our College’s unr.edu websites to share out forms is largely done through our College’s Websites Assets Management System or the University’s events platform, Localist.
How it’s done depends on whether the form is:
- Time-bound or evergreen.
- For internal (e.g., employees, volunteers, members) or external (e.g., general public) use.
- For use in print or for completion online
If the form is evergreen, for use in print or completion online, AND
- It’s for an internal audience, enter it into the Publications database in WAM, in the “Forms/Templates – Internal Use” category.
- Be sure to check all relevant website areas and counties.
- That’ll include it on relevant employee and volunteer webpages, such as the , or webpages.
- It’s for an external audience, enter it into the Publications database in WAM, in the “Forms” category.
- Be sure to add all relevant co-authors and check all relevant website areas, food systems pillars and counties.
- That’ll include it in relevant Experiment Station and Extension publications libraries, as well as on relevant county and program webpages.
If the form is time-bound AND for
- Event registration, update the events.unr.edu webpage for the event in Localist to include registration directly (for free events) or link to registration through a third-party tool such as Eventbrite (for paid events). Then, update the relevant program webpage through the Programs database in WAM to include an events widget, which will showcase this event and its registration form automatically.
- For details on events and registration, see the University’s webpage on Localist and the College’s Eventbrite guide.
- If the event doesn’t yet have an events page, see the University’s webpage on Localist for info on creating one. If it does, but you don’t have access to it, contact your team member who created it, or reach out to the College’s web team for support.
- For assistance with events widgets, send in a web support request.
- Other use online, update the relevant program webpage through the Programs database in WAM to include a link to the form.
- Pro tip: Set a calendar reminder for yourself to go back and delete the form’s link from the program’s page once the form submission deadline has passed.
- If the program doesn’t have a page in the database yet, or it does, but you don’t have access to it, contact the College’s web team for support.
- Other use in print (NOT RECOMMENDED), enter it into the Publications database in WAM, in the “Forms” category. Then, update the relevant program webpage through the Programs database in WAM to include a link to the form.
- Set a calendar reminder for yourself to go back and delete this form from the Publications database and the program’s webpage after its submission deadline has passed.
How to update your profile page
Adding a profile photo
- Open a web browser (e.g., FireFox, Chrome, Oprea, etc.) and log into the .
- If this is your first time logging into the system, then put your University email (@unr.edu) into the Username box and click RESET Password. Follow the instructions that are emailed to you, then log in with your new password.
- Click Profile Photos.
- Scroll down to see bad profile photo examples and good profile photo examples. Choose a profile photo that follows the good examples.
- If you need help getting a photo that follows the good examples, contact the Communications Team and we will help put you in touch with someone to take the photo.
- Photos should be:
- 640x640px (1:1 ratio).
- Jpeg/jpg.
- Less than 800Kb.
- Click Choose File and upload your properly-sized photo.
- Add alt text (you can just put your name here).
- Click Upload Image.
Adding and updating profile information
We encourage you to fill in as much information as possible, as more information is better; however, you can keep it simple to get started.
Tip: Pull up your LinkedIn profile. Many of the fields are the same, so you can just copy-paste.
- Before logging into the Personnel Management System, create a Word document that includes:
- A short description – this is a couple of sentences about your specialties and areas of expertise. This shows up as part of a search engine's description of the link to your page. Limit 670 characters including spaces (approximately 100 words).
- The website’s search engine looks at this box, so include keywords related to your specializations and areas of expertise.
- A longer, general description – more details about your current efforts. What cool things are you doing in research, teaching and outreach?
- A list of keywords
- List your keywords left-to-right in order of priority and importance.
- Include words that a general audience might Google.
- Include common misspellings of keywords.
- Include words that might be used in-house, such as jargon and acronyms.
- Include your first and last name, including common misspellings.
- Optional:
- A list of earned honors and awards.
- A list of non-job-related volunteer activities (called “Community Service” in the form).
- A list of accomplishments.
- A short description – this is a couple of sentences about your specialties and areas of expertise. This shows up as part of a search engine's description of the link to your page. Limit 670 characters including spaces (approximately 100 words).
- Open a web browser (e.g., FireFox, Chrome, Oprea, etc.) and log into the .
- If this is your first time logging into the system, then put your University email (@unr.edu) into the Username box and click RESET Password. Follow the instructions that are emailed to you, then log in with your new password.
- Click Profile Information.
- Check your general information. Pay special attention to your name, department, position and title. Otherwise, you may be listed as a classified accountant 1, as it sometimes defaults to alphabetical order.
- Most people have a working title they want seen instead of the classified or faculty title. To update it, you must have "Yes" selected from the Alternate Title dropdown. WARNING: the alternate title will display instead of the classified or faculty title, so if you want both the working title and the other title displayed, type both in the Alternate title space (e.g. Professor and Extension Educator).
- CLICK SAVE INFORMATION AT LEAST ONCE PER HOUR – the system will kick you out if you appear “inactive” for an hour, and it doesn’t recognize typing in the description boxes as being active. Saving will remove you from the page – simply click Return Main Menu at the top left of the button ribbon, then click Profile Information.
- Input relevant education information.
- Select all relevant program areas – this lets people find you when they find stuff related to you.
- In the short description box, copy-paste your pre-written short description with no formatting.
- Keyboard shortcuts:
- Windows: Ctrl + Shift + v
- Mac: Command + Shift + v
- Keyboard shortcuts:
- Copy-paste your pre-written list of keywords.
- Copy-paste your pre-written long, general description with no formatting.
- List college courses you teach in the "Detailed Description of your teaching efforts" box. If you don't teach a college course, leave this box blank.
- Copy-paste your optional sections with no formatting.
- Click Save Changes.
How to create or edit an Extension program page
Adding a new Extension program page
- Before logging into the , create a Word document that includes:
- A short program description – this gives end users a quick summary of what the program is about. Limit 670 characters including spaces (approximately 100 words).
- A long program description – for most programs, this is the program’s main webpage. It can include details about the program’s activities, upcoming classes, accomplishments and achievements, impact statement, history, etc.
- , log into the .
- Click Extension Programs.
- Click Add New Program.
- Add the program title.
- Copy-Paste your short and long descriptions with no formatting; you can reformat afterward. WARNING: Microsoft Word is weird and failure to remove formatting may break accessibility, which means your publication may not be approved for posting to the website.
- Keyboard shortcuts:
- Windows: Ctrl + Shift + v
- Mac: Command + Shift + v
- To preview, click Save at the bottom left of the page, then within the Edit Program page, click Preview in the button ribbon at the top.
- CLICK SAVE CHANGES AT LEAST ONCE PER HOUR – the system will kick you out if you appear “inactive” for an hour, and it doesn’t recognize typing or formatting in the Long Description box as being active. The button is at the bottom of the page.
- The University-required annual training for people who create, edit or post content online will help you in making the webpage version of your publication accessible. Log into to take the training online or visit Teaching & Learning Technology's website to enroll in an in-person session.
- Keyboard shortcuts:
- Add keywords
- List your keywords left-to-right in order of priority and importance.
- Include words that a general audience might Google.
- Include common misspellings of keywords.
- Include words that might be used in-house, such as jargon and acronyms.
- Include last names of program leaders and contacts, including common misspellings.
- Select all relevant website areas – this lets your program show up on related pages.
- Optional: If your program does have a separate website, you can add the website’s link to the Outside Link section.
- If the somewhere else on the web is an Extension website (e.g. livingwithfire.info), it must be accessible.
- When the page looks the way you want, Click Submit for Review at the bottom right of the page. The communication’s team will receive an email asking them to review your submission for ADA compliance. If it passes, they will allow the program to show up on the website. If not, they will let you know that changes need made.
Editing an existing Extension program page
- Follow steps 1-3 for Adding a new Extension program page.
- Find the program you want to edit in the list. Click Edit in the left column.
- Make edits using steps 5-10 for Adding a new Extension program page as a guide, plus any steps for embedding photos.
- To preview, click Save on the bottom left of the page, then within the Edit Program page, click Preview in the button ribbon at the top.
- When the page looks the way you want, Click Submit for Review at the bottom right of the page.
Adding a calendar widget to an existing Extension program page
- Visit the University's link.
- In the Template dropdown, select Default. (Other selections are not accessible and must not be used.)
- In the Number of Results field, type 50. This is the maximum number of results that the widget can display.
- In the Days Ahead field, type 365. This is the maximum number of days that the widget can display.
- Configure the widget to display only the events related to your program by doing one of the following:
- In the Groups dropdown box, select the unit or department for which you are building this widget.
- In the Group-Specific Special Topic dropdown box, select the relevant offices and programs. If there is not one specific enough to your program, you can narrow things down further by using the Keywords and Tags box.
- If using the Keywords and Tags box, be sure the keyword you enter is unique enough that no other Extension or University program would use it. If the keyword is not unique and it is used by other Extension or University programs, their events will be pulled by the widget onto your program page.
- In the Content Must Match dropdown, select At least one place, group, keyword or tag, and one filter item.
- In the Widget Type dropdown, select List. (Other selections are not accessible and must not be used.)
- In the Style dropdown, select Classic. (Other selections are not accessible and must not be used.)
- Click Preview Widget. A new browser tab will open. It will show which upcoming events your widget will pull.
- Troubleshooting: If an event should appear here, but it doesn't, check that it's been posted to the calendar. Then, check that it's been tagged with the correct Groups, Group-Specific Special Topics, and Keyword and Tags. There is a delay from when you post or update an event to when the widget code will show it. You may have to wait awhile and press refresh a few times. If that doesn't work, check that none of the widget builder's Excluded Content boxes are completed. If that doesn't work, try different Content Must Match selections.
- Once you get the preview to pull events like you would like it to, click Generate Embed Code. Keep this window or browser tab open.
- , log into the .
- Find the program to which you want to add a calendar widget in the list. Click Edit in the left column.
- In the Long description buttons, click Source. This will show you in the text of the Long description box all of the code and content on your program page.
- Highlight all of the text in the Long description box, copy it and paste it somewhere safe. The database does not save backup copies of your program webpage. You want to have a copy to restore if adding the widget doesn't go as planned.
- Click Source again. This will show you the look and content of your program page.
- At the end of the content there (you may have to scroll down in the box), click into the box and type in the box the heading for your calendar. For example, Upcoming Events.
- Use the Long description buttons' Format dropdown box to set the appropriate heading level for the heading of your calendar.
- Click Source again. Keep this window or browser tab open.
- On your other window or browser tab that you kept open from Step 7, click in the Widget Embed Code box, highlight all of the code there and copy it.
- On your program website window or browser tab that you kept open from Step 15, scroll all of the way down to the end of the content there below your calendar heading from Steps 13-14. Paste the widget embed code. It should look something like this.
Widget Embed Code <div id="localist-widget-70628945" class="localist-widget"></div><script defer type="text/javascript" src="https://events.unr.edu/widget/view?schools=reno&days=31&num=50&container=localist-widget-70628945&template=modern"></script><div id="lclst_widget_footer"><a style="margin-left:auto;margin-right:auto;display:block;width:81px;margin-top:10px;" title="Widget powered by Localist Event Calendar Software" href="https://www.localist.com?utm_source=widget&utm_campaign=widget_footer&utm_medium=branded%20link"><img src="//d3e1o4bcbhmj8g.cloudfront.net/assets/platforms/default/about/widget_footer.png" alt="Localist Online Calendar Software" style="vertical-align: middle;" width="81" height="23"></a></div> - Delete this part of the code that you just pasted:
Code to Delete <div id="lclst_widget_footer"><a style="margin-left:auto;margin-right:auto;display:block;width:81px;margin-top:10px;" title="Widget powered by Localist Event Calendar Software" href="https://www.localist.com?utm_source=widget&utm_campaign=widget_footer&utm_medium=branded%20link"><img src="//d3e1o4bcbhmj8g.cloudfront.net/assets/platforms/default/about/widget_footer.png" alt="Localist Online Calendar Software" style="vertical-align: middle;" width="81" height="23"></a></div> - To preview, click Save at the bottom left of the page, then within the Edit Program page, click Preview in the button ribbon at the top.
- CLICK SAVE CHANGES AT LEAST ONCE PER HOUR – the system will kick you out if you appear “inactive” for an hour, and it doesn’t recognize typing or formatting in the Long Description box as being active. The button is at the bottom of the page.
- When the page looks the way you want, Click Submit for Review at the bottom right of the page. The communication’s team will receive an email asking them to review your submission for ADA compliance. If it passes, they will allow the program to show up on the website. If not, they will let you know that changes need made.
- One ADA compliance issue common with calendar widgets are events with the same name. If you have multiple events with the same name, enter them on the calendar as one event that repeats, not as separate events. If that's not appropriate for your event and you must enter them as separate events, then customize each event's title so that no two are the same.
How to add scholastic works to an Extension program page
- Log in to the .
- Add the publication to the Website Assets Management System database. Only publications in the database can be added to Extension programs.
To add multiple scholastic works to a single program:
- Once the publication is in the database, on the Main Menu, click Extension Programs.
- Find the program you want to add a scholastic work to and click “Pubs” in the fifth column.
- Use the filters to find the scholastic work you want to add.
- Click Edit next to the scholastic work.
- On the far right, mark Add.
- On the left, click Update.
To add a single scholastic work to multiple programs:
- Once the publication is in the database, on the Main Menu, click Publications.
- Find the scholastic work you want to add to the program pages and click “Programs” in the fifth column.
- Select the program you want from the dropdown list.
- Click Add Program.
- Repeat until all desired programs are added.
How to create or edit publication pages
- Before logging into the , create a Word document that includes:
- A short description – this gives end users a quick summary of what the publication is about and why the end user should read it. Limit 320 characters including spaces.
- A list of keywords:
- List your keywords left-to-right in order of priority and importance.
- Include words that a general audience might Google.
- Include common misspellings of keywords.
- Include words that might be used in-house, such as jargon and acronyms.
- Include last names of all authors, including common misspellings.
- If your scholastic work includes embedded images, . Log into the .
- If this is your first time logging into the system, then put your University email (@unr.edu) into the Username box and click RESET Password. Follow the instructions that are emailed to you, then log in with your new password.
- Click Scholastic Works.
- Click Add New Records.
- In the Authors box, list ALL authors in order of authorship.
- Add all CABNR, Experiment Station and Extension authors from the provided list – this allows the scholastic work to show up on people’s profiles.
- Fill in the "Year Originally Published," "Title," and "Published In" fields accordingly.
- If the publication is not in a specific journal, newspaper, newsletter, etc., you can use the following format for the "Published In" field: "Extension, 91·зГщДсіЄ," followed by a category such as Forms or Blog Posts.
- Copy-paste your list of keywords.
- Fill in the "Category," "Peer Reviewed," "Featured Publication," "Language," and "Peer Reviewed" fields accordingly.
- Select all relevant website areas – this lets your publication show up on related pages.
- Copy-paste your pre-written short description.
- Any of the following:
- Copy-Paste from the document to create a webpage version. This is recommended for smaller publications such as Fact Sheets and Special Publications, as it is easier to make them ADA compliant. CLICK SUBMIT INFORMATION AT LEAST ONCE PER HOUR – the system will kick you out if you appear “inactive” for an hour, and it doesn’t recognize typing or formatting in the webpage version box as being active. The button is at the bottom of the page.
- The University-required annual training for people who create, edit or post content online will help you in making the webpage version of your publication accessible. Log into to take the training online or visit Teaching & Learning Technology's website to enroll in an in-person session.
- Paste with no formatting; you can reformat afterward. WARNING: Microsoft Word is weird and failure to remove formatting may break accessibility, which means your publication may not be approved for posting to the website.
- Windows: Ctrl + Shift + v
- Mac: Command + Shift + v
- To preview, click Submit Information, then within the Edit Publication page, click Preview in the button ribbon at the top.
- Upload the publication as a pdf. WARNING: uploaded documents that are not ADA compliant will not be approved for posting to the website.
- Copy-Paste from the document to create a webpage version. This is recommended for smaller publications such as Fact Sheets and Special Publications, as it is easier to make them ADA compliant. CLICK SUBMIT INFORMATION AT LEAST ONCE PER HOUR – the system will kick you out if you appear “inactive” for an hour, and it doesn’t recognize typing or formatting in the webpage version box as being active. The button is at the bottom of the page.
- Optional: If your scholastic work shows up somewhere else on the web, such as a blog post, Nevada Today article or a journal article, you can add the website’s link to the Outside Link section.
- If the somewhere else on the web is an Extension website (e.g. livingwithfire.info), it must be accessible.
- If you want this to be one of the top 10 scholastic works on your personal profile page, select YES.
- Click Submit. Robert and Ashley will receive an email asking them to review your submission for ADA compliance. If it passes, they will allow the publication to show up on the website. If not, they will let you know that changes need made.
How to create or edit an events page
All happenings hosted by our College, including those that are a part of a program, should be posted to . This events platform, powered by a software called Localist, populates all events calendars, pages and widgets across all University, College, unit, department, office and program webpages.
Simple events should be posted using the . Complex events should be posted using the .
The use of either form will result in the creation of a webpage for the event. Additionally, the proper completion of the event tags section of the form will result in the event’s inclusion on all relevant University, College, unit, department, office and program webpages.
For detailed instructions, see the University's Localist guide. It includes information and links on:
- How to submit an event
- How to add images and alternate text to your events
- How event feeds and Group tags help you promote your events
- How to become an event admin, able to edit and manage events for your unit or department
- The Localist platform and using Localist for conferences
Running a paid event? See our Eventbrite guide for details and resources for paid events.
Images
Image accessibility
Because of the funding the University receives, we are bound by federal law on accessibility to make sure everyone is able to experience the content on our site. A recent legal agreement between the University and the Office of Civil Rights in Washington, D.C. also obligates us to make our site content accessible. Plus, Extension’s purpose is to help people, including people who have an ability difference.
Alternate text, also known as alt text, helps people with visual impairments who use screen readers; however, not everyone with a visual impairment uses a screen reader. So, adding alt. text to an image with text on it will still leave some people with disabilities unable to experience the content on our site.
The accessibility checker that is used to monitor the University’s compliance with the legal agreement has a manual check in place that causes every single image to be examined for text. If an image without text cannot be found, the University’s placeholder image for missing visuals will automatically show up.
Adding alternate text to images
Alternate text is a short, written description of an image that captures in text what the image conveys visually.
When added to an image, alternate text:
- Helps people who use screen readers to understand the information the image conveys.
- Provides extra info to search engines, helping our pages to show up well in search results.
- Shows up in place of the image, if the image fails to load. Sometimes website visitors with limited data or on slow connections change their settings to ensure images don't show up. They'll see the alternate text instead.
To add alternate text:
- Follow the instructions below for adding images.
- They cover adding the alt text to the image and include basic tips on writing good alt text for images.
Embedding images
Images must be jpegs that are no wider or taller than 586px. They can be smaller.
Tip: Check out for videos on how to prepare images for the web.
- Place your cursor where you want the image to appear.
- Click the Image icon found in the second row of formatting buttons – the box with mountains.
- Click Upload, the third tab across the top.
- Click Browse and select your jpeg image.
- Click Sent it to the Server. This will automatically bounce you back to the Image Info tab.
- This will also give your image a url. If you save this url, then you can embed the image in other programs and publications on the website without having to re-upload it.
- Add alt text. Make sure it’s a brief and literal description of the photo, tying it to the program if possible (e.g. “two 4-H girls doing backflips,” “Master Gardener taking grape-inspection notes on a clipboard” or “peaches on a tree”).
- Delete the numbers in the Width and Height fields, leaving them blank. This keeps the image from getting distorted on tablet and mobile phone screens.
- Make sure words don’t touch the image by adding values to the HSpace (horizontal padding) and VSpace (vertical padding) fields.
- If you want the image to float to the right with text filling the left side change the “Alignment” to right. The opposite will occur if “Alignment” is set to the left.
- Click OK, then preview your page by clicking Save Changes at the bottom of the edit screen, which will return you to your list of programs. Click Edit next to the program again, then click Preview Page at the top of the edit screen.
- To edit your image, click the image and click the Image icon. Rinse and repeat until the page looks like you want it.
- When you’re happy with the preview, click Submit for Review. Robert and Ashley will receive an email asking them to review your submission for ADA compliance. If it passes, they will allow the changes to show up on the live site. If not, they will let you know it needs fixed.
WARNING: unlike preset image types, embedded images require you to click Submit for Review when finished. Failure to submit for review means changes will not be approved for posting to the live site.
Preset images
There are three preset image types for programs and scholastic works: content blocks, banners and thumbnails. These image types show up with program and scholastic works titles and descriptions throughout the website.
Preset images are added separately and are not part of the process of adding a program or scholastic work to the database.
Each program or scholastic work can have only one of each of these image types.
Content blocks
Content blocks and thumbnails are required for a program page to be approved to show up on the website. However, after the initial approval, they can be updated without needing to contact the communication team. For programs, these images show up on the , in the Featured Programs ribbon and as related programs within website areas and in the sidebar on publication webpages.
For publications, these images show up in the Featured Publications ribbon on the Learn About pages.
Content blocks must be:
- 800x600px (4:3 ratio)
- .jpg
- Less than 500kb
Banners
Banners are the long, skinny images that show up behind the program or publication name on the program or publication web page. These are optional – if you don’t add one, a stock one will be used.
Banners must be:
- 1,200 x 500px
- .jpg
- Less than 800kb
Thumbnails
For programs, thumbnails are what show up next to programs when a keyword search is performed in the “What do you want to learn about?” search field.
For publications, thumbnails are what show up next to publications at the bottom of Extension program pages and when a keyword search is performed in the “What do you want to learn about?” search field.
Thumbnails must be:
- 300x300px (1:1 ratio)
- .jpg
- Less than 200kb
How to add a preset image to a program page:
- to log into the .
- Click Extension Programs.
- Find the program you want to add a photo to and click Images in the fourth column.
- Click Browse and select your properly-sized jpeg image.
- Add alt. text. Make sure it’s a brief and literal description of the photo, tying it to the program if possible (e.g. “two 4-H girls doing backflips,” “Master Gardener taking grape-inspection notes on a clipboard,” or “peaches on a tree”).
- Mark either “Banner,” “Content Block” or “Thumbnail.”
- Click Upload Photo. Your image will immediately show up on the live site.
How to add a preset image to a publication page:
1. to log into the .
2. Click Publications.
3. Find the publication you want to add a photo to and click “Images” in the eighth column.
4. Scroll to the section on the preset image type you'd like to add (e.g. Add Thumbnail Image, Add Content Block Image or Add Banner Image).
5. Click Browse and select your properly-sized jpeg image.
6. Add alt text. Make sure it’s a brief and literal description of the photo, tying it to the program if possible (e.g. “two 4-H girls doing backflips,” “Master Gardener taking grape-inspection notes on a clipboard,” or “peaches on a tree”).
7. Click the Add button for the preset image type you're adding (e.g. 1x1 Thumbnail Image, 4x3 Block Image or Banner).
Links
Links disclaimer
Use when you build a webpage with links to other entities:
These links are provided for informational purposes only. Extension does not guarantee the accuracy or completeness of the information which the listed sites may contain nor does Extension endorse any products or services these sites may provide or advocate.
Creating NevadaBox links
If you’re going to house a file in NevadaBox and link to it from your website, here are to secure the document from editing and to make sure that it’s available to website users.
Sept. 29, 2009
Policy on purchasing internet domain names
What's a domain name?
A domain name or host name is a name which, when entered into the address box on an internet browser, points/forwards the browser to a specific server on the internet. Extension's domain name is extension.unr.edu. Sometimes, a shorter domain name that is specific to a program name is purchased for marketing purposes. This shorter domain name would point/forward a user to a specific location on a website, such as the Extension website.
If I want to purchase a domain name, what do I need to do?
First, contact the College's director of communications and get permission to purchase a domain name. Domain names are generally a multi-year commitment, i.e. a name we want our audiences to remember and use to find us well into the future. Once approved, the following information should be sent to the College's webmaster:
- The domain name you want to purchase.
- The URL you want the domain name to point to, i.e. the page on one of the College's websites that you want the user linked to when they type the domain name into their address box.
- The account number the purchase should be charged to.
Important notes
Domain names should only be purchased when:
- Continual funding is available
- There is an ongoing staffing commitment for keeping the site updated
- The program ongoing.
Expired domain names can be purchased by anyone and repointed to anywhere they please. Reportedly some organizations have let their domain names expire and those domain names were subsequently purchased by devious companies who pointed them to porn sites. When the organizations asked to buy the domain names back, the domain names were held hostage and they were asked to pay thousands of dollars.
When considering the purchase of a domain name, please recognize the name will direct users to a location other than our websites' homepages. Preferably, we want to direct users to our websites' homepages to get a broad overview of our diverse programs and read our feature stories and news. This way, they'll:
- Have an idea of the important issues our College is addressing.
- Help spread the word to their family, friends, neighbors and decision makers.
While a limited number of domain names will direct specific audiences to the resources they seek, too many domain names will bypass our websites' homepages and could hinder efforts to market our diverse programs to multiple audiences.
Making graphs and charts accessible
Images of graphs and charts are inherently inaccessible. Information in them is not conveyed at all to people who are viewing them using a screen reader. And, information in graphs and charts can be hard to read for people with colorblindness or low vision. To make our graphs and charts as accessible as possible for all viewers, we should design our graphs and charts with accessibility and universal design principles in mind, and include extra information with our graphs and charts.
This is not only the right thing to do and the thing to do if we want our information to reach all of the communities we serve, it's required by law, University policy and our legal agreement with the Office for Civil Rights.
When designing graphs and charts
- Title graphs and charts descriptively.
- Label axes clearly.
- Add labels for each line or bar.
- Add values to bar charts.
- Use colors that have enough contrast to each other and the chart’s background color.
- Stay away from combinations of colors that people with colorblindness have trouble perceiving:
- Blue & grey
- Blue & purple
- Light green & yellow
- Green & black
- Green & blue
- Green & brown
- Green & grey
- Green & red
- Make sure the graph or chart is readable in black and white / grayscale.
- Use patterns, texture and/or symbols in your graphs and charts so that no information in them is conveyed only by color. (Example: Dot the blue line and dash the black line in your line chart and your line chart’s key.)
- Stay away from special effects.
Then, include a text summary of the graph or chart and a properly coded table of the data in the graph or chart near the graph or chart. And, in the alternate text of the graph or chart, very succinctly state the type of chart, what key trends it’s showing and “See table for data.” Also describe trends shown by the graph or chart, conclusions, and calculations in the surrounding text.
Adding accessible tables to webpages
These instructions will help people to create tables in Extension publication webpages and on Extension program webpages, provided that the tables:
- Are created to display data, not for layout
- Are simple, without merged columns or cells and without blank cells
- Include a table title (known as a caption)
- Include table headers
Note: To meet the requirements of federal law and University policies on accessibility, if tables for Extension publication and program webpages were not created as described above, you may need to adjust them and/or learn more about using HTML to create tables. Common adjustments for tables not created with accessibility in mind include:
- Changing the columns in a complex table to simplify its layout
- Splitting complex tables into multiple simple tables
- Inserting provided snippets of HTML code
To learn more, see the section on complex tables below.
Features of a properly coded table
- Caption
- Column and row headers
- Data cells associated with their headers
- No blank or merged data cells
Making simple tables accessible
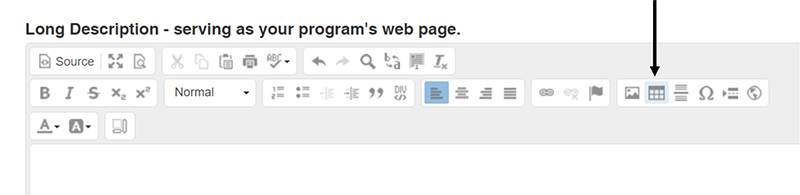
- Click the Create Table button in the WYSIWYG.
- WYSIWYG stands for "what you see is what you get." It's the system that allows you to create and edit web content without having to know too much code. Its similar to how Word allows you to create and edit documents. It looks like two rows of big friendly buttons, including the buttons to bold and italicize text.
- When working on an Extension publication webpage, the WYSIWYG is located directly under the "Webpage Version of Publications" header. When working on an Extension program webpage, the WYSIWYG is located directly under the "Long Description - serving as your program's webpage" header.
- The table button is in the WYSIWYG's second row's sixth button group. It looks like a dark gray and white rectangle that is divided into smaller squares.
- Once you click the Create Table button, a Table Properties box will pop up.
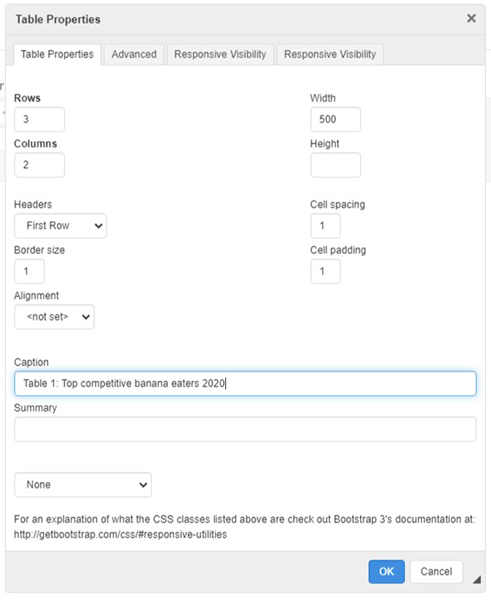
- On the box's Table Properties tab, complete the following fields.
- Rows: Enter the number of rows you expect to have. You can change the number of rows in your table later.
- Columns: Enter the number of columns you expect to have. You can change the number of columns in your table later.
- Headers: Headers allow screen reader users to experience the table similarly to how sighted users do visually. Your table must have headers. If it doesn't, it's not accessible. Per University policy, inaccessible tables cannot be posted on our websites.
- First Row: Select if the first row of your table is labels for each column.
- First Column: Select if the first column of your table is labels for each row.
- Both: Select if the first row of your table is labels for each column AND the first column of your table is labels for each row.
- Caption: The table caption is the title of the table. For example, "Table 1: Top competitive banana eaters 2020." Your table must have a caption. If it doesn't, it's not accessible. Per University policy, inaccessible tables cannot be posted on our websites.
- Note: Completing the header and caption fields provides enough accessibility markup for most simple tables. If you have a complex table on your hands, you may need to adjust it, split it into multiple tables and/or learn more about using HTML to create tables. See the section on complex tables below.
- Click the OK button. You should now see a blank table in the WYSIWYG's text box. Important: The blank table should include a caption, and its header cells should be a different color than the regular cells. If the table you're seeing doesn't match this description, you'll need to delete the table and try again.
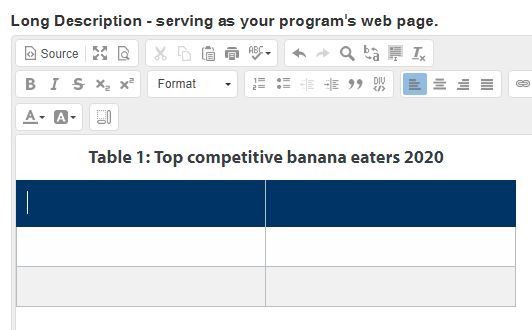
- Enter your table's data by clicking in each of its cells and typing in the cells' values.
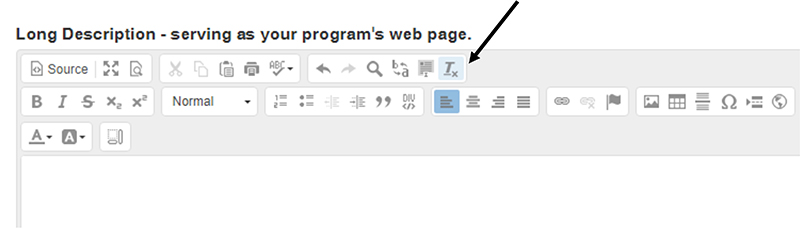
- Copy and paste the values without formatting if working from an existing table. To do this, paste by holding down ctrl+shift+v. If you don't, the WYSIWYG will attempt to carry over formatting from the original document. It likely won't work well and may make your table fail to meet branding and/or accessibility requirements. If you forget this step, you may be able to fix it by clicking the remove format button in the WYSIWYG. It's the last button in the first row. It looks like an italicized and underlined capital T next to a subscript x.
- Complete all cells. Do not leave cells blank. If you are working from a table created without accessibility in mind, you may have to figure out what a blank cell meant in the mind of the table's original author. Did it mean the data collected for that cell was 0? Did it mean data for that cell was not collected at all? You may need to ask the table's original author to clarify. Then, enter the appropriate value. It's OK to enter 0, N/A or not applicable, if that's indeed what should go there. Your table must not have blank cells. If it does, it's not accessible. Per University policy, inaccessible tables cannot be posted on our websites.
- Leave cells separate. Do not merge cells. It's tempting, but for accessibility, do not merge cells. If you are working from a table created without accessibility in mind, you may need to change or add more columns to avoid merged cells. Or, you may need to split the complex table into several simple tables to avoid merged cells. To learn more, see the section on complex tables below. Your table must not have merged cells. If it does, it's not accessible. Per University policy, inaccessible tables cannot be posted on our websites.
- Add columns and rows, as needed. But remember, the number of columns and rows in the table must be uniform throughout it. Do not add or delete cells so that a row or column is longer or shorter than the others. Your table must have a uniform number of rows and columns. If it doesn't, it's not accessible. Per University policy, inaccessible tables cannot be posted on our websites.
- To add another row to the table, right click in it. Choose row in the box that pops up. Then, choose insert row before or insert row after. Or, click in the last cell of the last row of the table. Then, press the Tab key on your keyboard. To delete a row from the table, right click in it. Choose row in the box that pops up. Then, choose delete row.
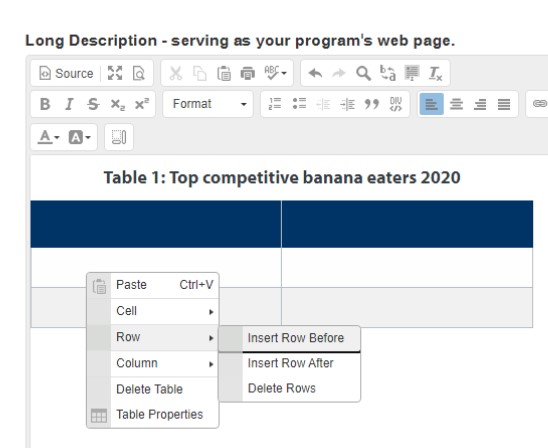
- To add another column to the table, right click in it. Choose column in the box that pops up. Then, choose insert column before or insert column after. To delete a column from the table, right click in it. Choose column in the box that pops up. Then, choose delete column.
- To add another row to the table, right click in it. Choose row in the box that pops up. Then, choose insert row before or insert row after. Or, click in the last cell of the last row of the table. Then, press the Tab key on your keyboard. To delete a row from the table, right click in it. Choose row in the box that pops up. Then, choose delete row.
- Copy and paste the values without formatting if working from an existing table. To do this, paste by holding down ctrl+shift+v. If you don't, the WYSIWYG will attempt to carry over formatting from the original document. It likely won't work well and may make your table fail to meet branding and/or accessibility requirements. If you forget this step, you may be able to fix it by clicking the remove format button in the WYSIWYG. It's the last button in the first row. It looks like an italicized and underlined capital T next to a subscript x.
Strategies to make complex tables accessible
Change it
This table isn't accessible. First, it's posted as an image, and text on images isn't accessible. It can't be read by screen reader users, and users who magnify the screen will struggle with a pixelated image that they have to scroll back and forth to view. Second, it includes multiple merged header cells. This would make it impossible for a screen reader to read the table to a user in a way that makes sense.
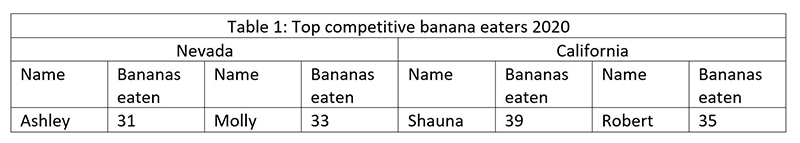
To make the above table accessible, we can change the table's layout. Be mindful that changing the table's layout can change how the data in the table is perceived. For example, changing the layout to the following places emphasis on and orders the data by the competitive banana eater's name. If the publication author or program lead would rather draw attention to and order the data by the state or number of bananas eaten instead, then we'd need to order the columns differently. Knowing the purpose of the table, the point it's trying to convey, will help you to choose the most appropriate accessible layout.
| Name | State | Bananas eaten |
|---|---|---|
| Ashley | Nevada | 31 |
| Molly | Nevada | 33 |
| Robert | California | 35 |
| Shauna | California | 39 |
Split it
Another way to make the above inaccessible table accessible is to split it in two. Again, be mindful of how the change in layout may impact how well the table gets its point across.
| Name | Bananas eaten |
|---|---|
| Ashley | 31 |
| Molly | 33 |
| Name | Bananas eaten |
|---|---|
| Robert | 35 |
| Shauna | 39 |
Code it
Another way we can make complex tables more accessible is by sharpening our HTML skills.
Code a total row
If your table includes a total row, you'll need to add a snippet of code to your table to help make it easier to read. This doesn't do anything for screen reader users, but it does set the row apart visually for sighted users. This can increase comprehension, especially among people with cognitive impairments.
- First, complete all of the steps under the making simple tables accessible section.
- Then, click on the source button in the WYSIWYG. It's the first button in the first row of the WYSIWYG. It says source on it and looks like a piece of paper with a clipped right corner.

- Find your table in the code by either scrolling to it or using ctrl+f to search for something unique in the table's contents.
- Once you find your table in the code, you'll paste the following code after the closing caption tag </caption> and before the opening table header tag <thead>: <tfoot> <tr> <td> </td> <td> </td> <td> </td> <td> </td> </tr> </tfoot>
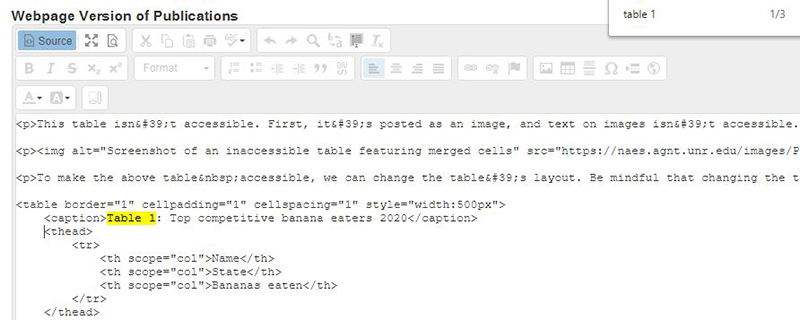
- Now, switch back to regular view by clicking the source button in the WYSIWYG.
- If the total row of your table has four cells in it, you're all set. If not, you'll need to add or remove cells from the total row until it has the same number of cells as the other rows in the table. To add cells, you'll right click in the total row, choose cell and select insert cell before or insert cell after. To remove cells, you'll right click in the total row, choose cell and select delete cell. It's important not to skip this step. Your table must have a uniform number of rows and columns. If it doesn't, it's not accessible. Per University policy, inaccessible tables cannot be posted on our websites.
- Finally, enter your total row's data by clicking in each cell of the row and typing in the cells' values.
Using data visualizations in webpages
These instructions will help people to add data visualizations to Extension scholastic works and program webpages in ways that are more accessible, provided those visualizations:
- Are simple.
- Use good color contrast.
- Use the appropriate chart type for the data.
- Feature clear axes labels, and legends and keys.
- Are accompanied by source and contact information.
- Use appropriate, clear and ethical scales for the data.
- Use secondary indicators of meaning,such as patterns or shapes, when meaning is conveyed by color.
- Where possible, use code to display the visualization instead of an image.
- Where possible, spell out the data's values.
Note: To meet the requirements of federal law and University policies on accessibility, if visualizations for Extension publication and program webpages were not created as described above, you may need to redesign them. Complex visualizations, such as infographics, are particularly challenging to design well. One tactic that may work is splitting complex visualizations into several simple ones. To learn more about working with complex images, see the .
Images of a data visualizations
- First, ensure your data visualization was designed with accessibility in mind. See the introduction above to learn more. If it wasn't designed with accessibility in mind, you will need to redesign it before moving to the next step.
- Insert the data viz into the webpage as an image, following the instructions on embedding images.
- Then, follow this formula to create alternate text for the image of the data visualization: "Chart type of type of data where reason for including the chart." (Cesal). Here are a few examples:
- Example 1: Graph or chart - "Line graph of number of bananas eaten per day in 2020 where more bananas are eaten during the COVID-19 pandemic."
- Example 2: Diagram - "Lifecycle of the banana plant where its two phases are vegetative and reproductive."
- Include a link to where a person can obtain all of the data/info that was presented visually in the data visualization in its image caption. Here are a few image caption examples:
- Example 1: Data you got from somewhere else - "Figure 1: Bananas eaten per day in 2020. Data from the USDA's 2020 Bananas Report." Link the text "USDA's 2020 Bananas Report" to the report on the USDA's webpage.
- If the data isn't available on the USDA's website (at the time of publication and/or publication recertification), either:
- Best option: Add "See Table 1." to the end of the caption, insert a table in the publication that contains all of the data from the chart, and link the text "See Table 1" to the table. See the instructions on adding accessible tables to webpages.
- Other option: Add info on requesting the report to the caption. "The report is available by request to bananas@usda.gov." Know that you will need to field requests from people if the USDA cannot fulfill requests accessibly, quickly or at all.
- If the data isn't available on the USDA's website (at the time of publication and/or publication recertification), either:
- Example 2: Data you collected - "Figure 1: Bananas eaten per day in 2020. See Table 1." Insert a table in the publication that contains all of the data from the chart, and link the text "See Table 1" to the table. See the instructions on adding accessible tables to webpages.
- Example 3: Diagram with info that was explained in the webpage - "Figure 1: The lifecycle of a banana plant. See Where do bananas come from?" Link the "See Where do bananas come from?" text to that heading in the document.
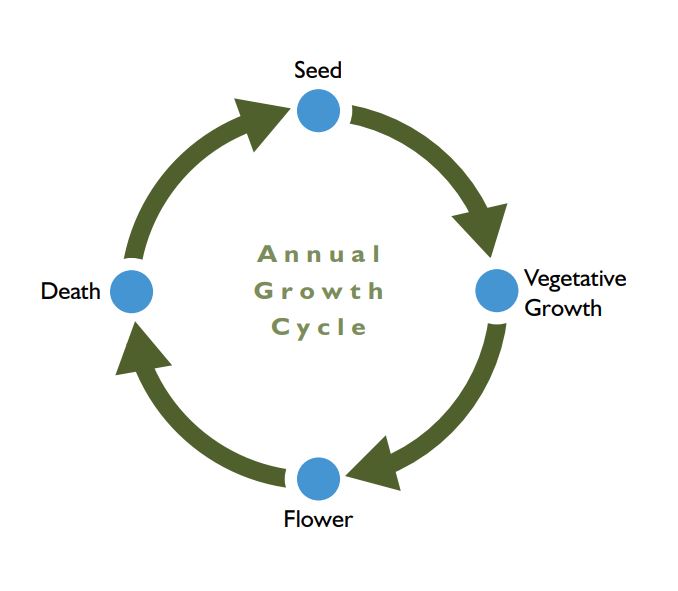
Figure 1: The lifecycle of an annual weed. See .
- Example 4: Diagram with info that was not explained in the webpage - First, consider adding a section to your webpage to explain your diagram. This will help everyone to better understand both your webpage and your diagram. If you make this change, you'll then follow Example 3 above. If you don't (WHY??!), then you'll follow this example: "Figure 1: The lifecycle of a banana plant includes two phases. The first phase is the vegetative phase. In this stage, the plant... The second is the reproductive phase. In this stage, the plant... (include all detail from the graphic)."
- Note: People pay attention to captions. You can take advantage of that attention to drive home the point of your data viz. This will help people with cognitive impairments to understand your point. Here's how:
- Traditional caption: "Figure 1: Bananas eaten per day in 2020. See Table 1."
- Point-driven caption: "Figure 1: Banana consumption soars during the pandemic. See table 1."
- Example 1: Data you got from somewhere else - "Figure 1: Bananas eaten per day in 2020. Data from the USDA's 2020 Bananas Report." Link the text "USDA's 2020 Bananas Report" to the report on the USDA's webpage.
Important: The alternate text and the image caption should not be identical.
Coding data visualizations
If you know how to code, you may insert data visualizations into Extension publication and program webpages provided that your code is accessible. Accessible materials are defined by the WC3 as perceivable, operable, understandable and robust. Here are standards and recommendations to guide you:
- University accessibility policy
- University benchmarks for accessibility
- WC3 standards for animation: , and
- WC3 standards for color: , and
- WC3 standards for interaction: , and
- WC3
Here are layouts and to use in your designs.
When you paste your code into the webpage, do so in the source view of the WYSIWYG. To switch to the source view, click the source button in the WYSIWYG. It's the first button in the first row of the WYSIWYG. It says source on it and looks like a piece of paper with a clipped right corner.
For an accessible simple infographic example, see the Kickoff to Kindergarten story in volume 33 of our College's newsletter.
References
- Cesal, A. (2020, August 11). .